Lecture overview:
Total time: ~55 minutes (tight)Theme: Debugging as detective work—systematic investigation, not random guessingPrerequisites: L5 readability (naming, code clarity), L13 AI coding assistants (workflow)Connects to: All future assignments (debugging is constant), final project Key connections to prior lectures:
L5 Readability: Good names and clear code make program understanding MUCH easierL13 AI Assistants: The 6-step workflow applies directly to debugging with AI The narrative:
Understanding code requires tracing control flow and data flow
Diagrams help visualize complex relationships
Debugging is the scientific method applied to code
Debuggers accelerate hypothesis testing
AI can assist, but you must understand the code yourself
→ Transition: Let's start with the learning objectives...
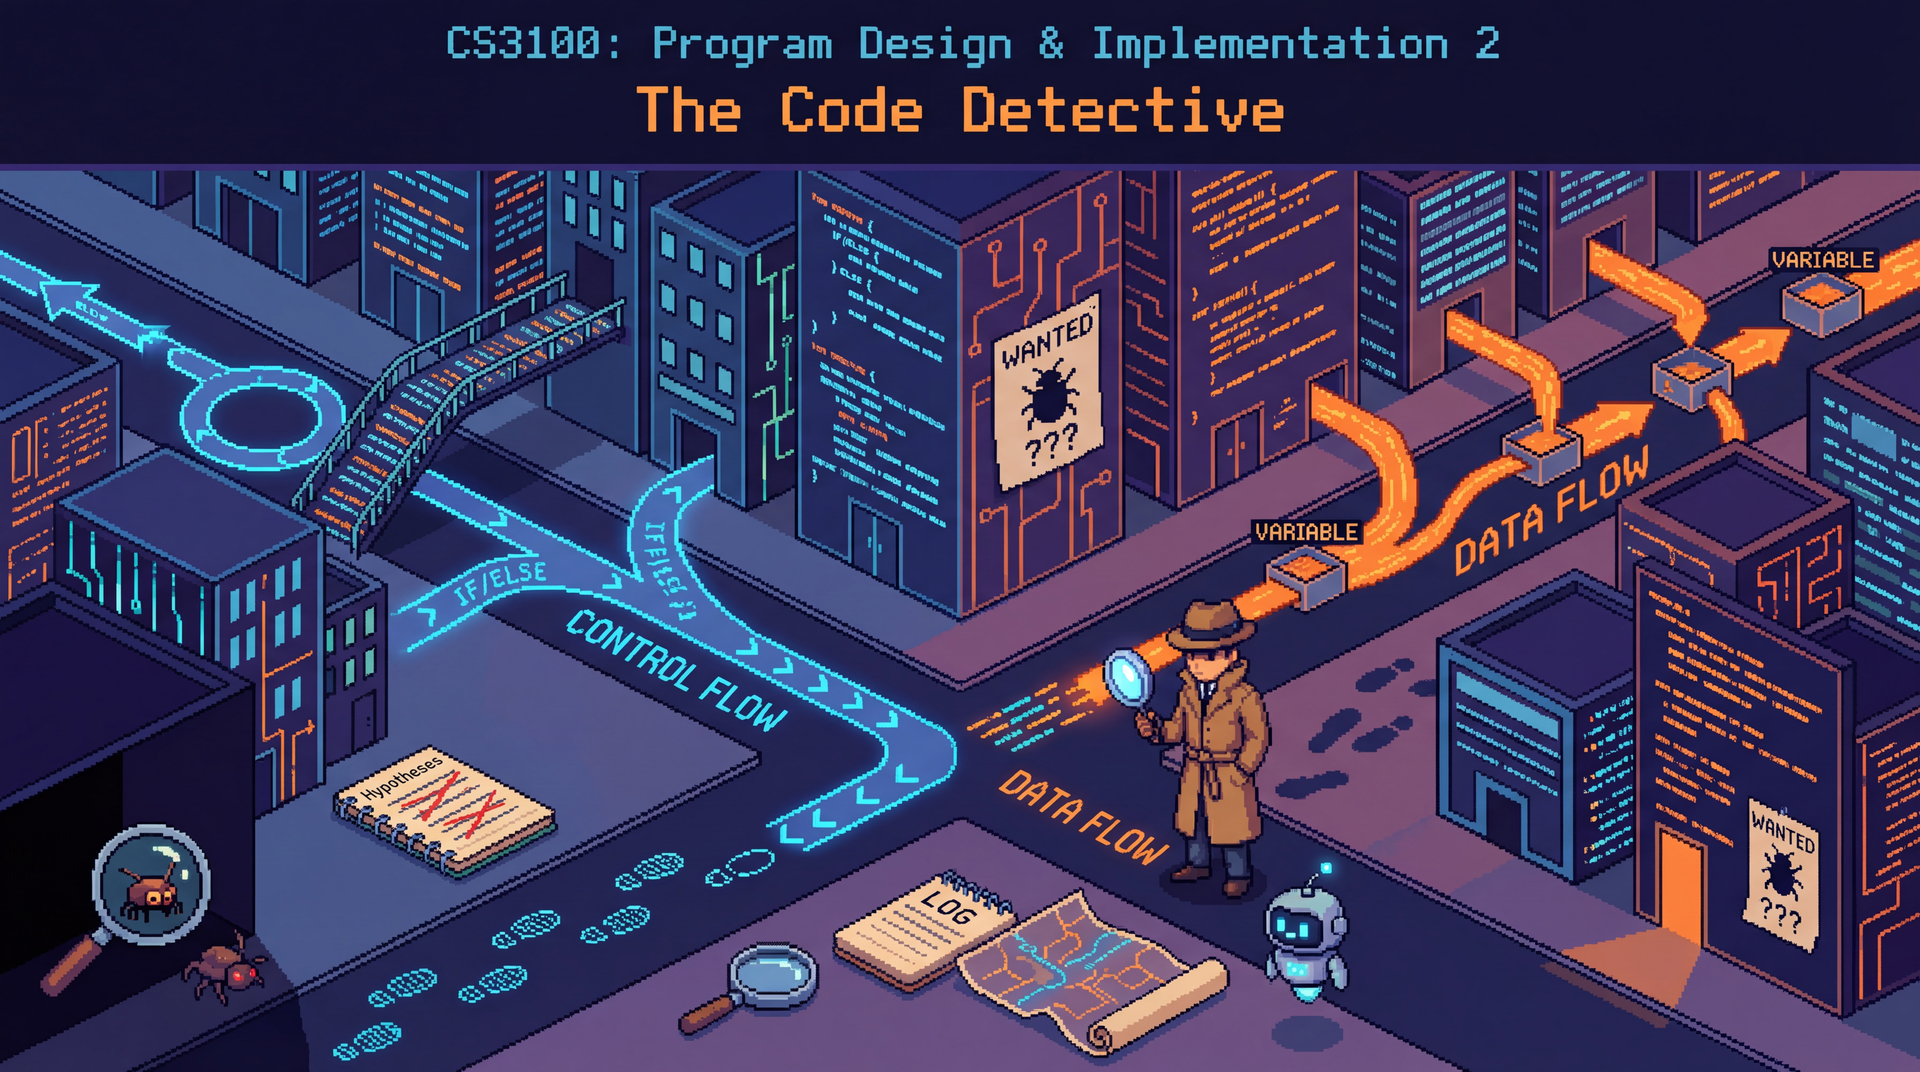
CS 3100: Program Design and Implementation II Lecture 14: Program Understanding & Debugging
©2026 Jonathan Bell & Ellen Spertus, CC-BY-SA
Quick title slide, move on to learning objectives.
→ Transition: Here's what you'll be able to do after today...
Poll: Why don't you use Oakland office hours or appointments? A. I didn't know you held them.
B. I'm not available at those times.
C. I prefer getting help from AI.
D. I prefer getting help from friends.
E. I prefer getting help through Pawtograder.
F. I don't think it would be helpful.
G. I don't know
H. other
Text espertus to 22333 if the
https://pollev.com/espertus
Answers are anonymous but count toward your participation grade.
Learning Objectives
After this lecture, you will be able to:
Utilize control flow and data flow analysis to understand a program Utilize diagrams (call graphs, sequence diagrams) to visualize program behavior Apply the scientific method to debugging Utilize a debugger to step through a program and inspect state Utilize an AI programming agent to assist with debugging Time allocation:
Control/data flow analysis (~10 min)
Diagrams and Mermaid (~8 min)
Scientific method of debugging (~15 min)
Debugger usage (~10 min)
AI for debugging (~9 min)
The thread: Build from understanding code → visualizing it → systematically debugging it → using tools to accelerate the process.
→ Transition: Let's talk about what's coming...
Coming Soon: Much Bigger Codebases A3 (this week!):
Starter code with 10+ interfaces: RecipeCollection, Cookbook, UserLibrary...
Inheritance hierarchies you didn't design
Jackson annotations you've never seen
Group project (March):
Teammates' code you need to understand and extend
"How do I even start understanding this codebase?"
The immediate challenge (A3):
RecipeCollection hierarchy: Cookbook, PersonalCollection, WebCollection
UserLibrary that holds collections
JsonRecipeRepository, JsonRecipeCollectionRepository
Jackson annotations for polymorphic serialization
The fear is real:
"There's so much code, where do I even begin?"
"What's @JsonTypeInfo? What's @JsonSubTypes?"
"How does CookbookImpl relate to Cookbook?"
Today's promise: We're learning the skills to tackle A3's codebase systematically—and these same skills scale to any codebase you'll ever work with.
→ Transition: First, let's see what your debugging instincts are...
Poll: How many hours per assignment do you spend debugging?
Text espertus to 22333 if the
https://pollev.com/espertus
Poll: When You Encounter a Bug, What's Your First Instinct? A. Add print statements everywhere
B. Start changing code to see what happens
C. Read the code carefully to understand it
D. Ask AI to fix it
E. Panic and consider dropping the class
Text espertus to 22333 if the
https://pollev.com/espertus
Discussion points:
No judgment—we've all done each of these
Print statements: Can help, but scattered prints are hard to follow
Changing code: "Vibe debugging"—dangerous without understanding
Reading carefully: Good start, but may need more systematic approach
Ask AI: Can help, but AI can't run your code or understand your context
Panic: Normal! But we'll give you better tools today
Key message: The goal is to move from reactive (panic, random changes) to proactive (systematic investigation).
→ Transition: This is a learnable skill...
Building Mental Models Understanding code = building a mental model .
Form a hypothesis: "I think UserLibrary stores recipes directly"Test it: Look at the interface—getCollections(), not getRecipes()Refine: "It stores collections that contain recipes"
Same process for debugging: hypothesis → test → refine
The key insight:
Understanding code and debugging are the SAME skill
Both involve forming and testing hypotheses about behavior
Both require building accurate mental models
A3 example (point to diagram):
First hypothesis: "UserLibrary holds recipes"
Test: Look at the interface methods → getCollections(), not getRecipes()
Refined model: "UserLibrary holds RecipeCollections, which hold Recipes"
The diagram SHOWS this—follow the arrows!
Connection to patterns (L7-L8):
Patterns are reusable mental models!
When you see CookbookImpl.builder(), you instantly know it's the Builder pattern
Pattern recognition accelerates understanding
Why mental models matter:
You can't hold entire codebase in your head
You need accurate models of how pieces interact
Wrong mental model = wrong assumptions = bugs
→ Transition: Two lenses help us build these models...
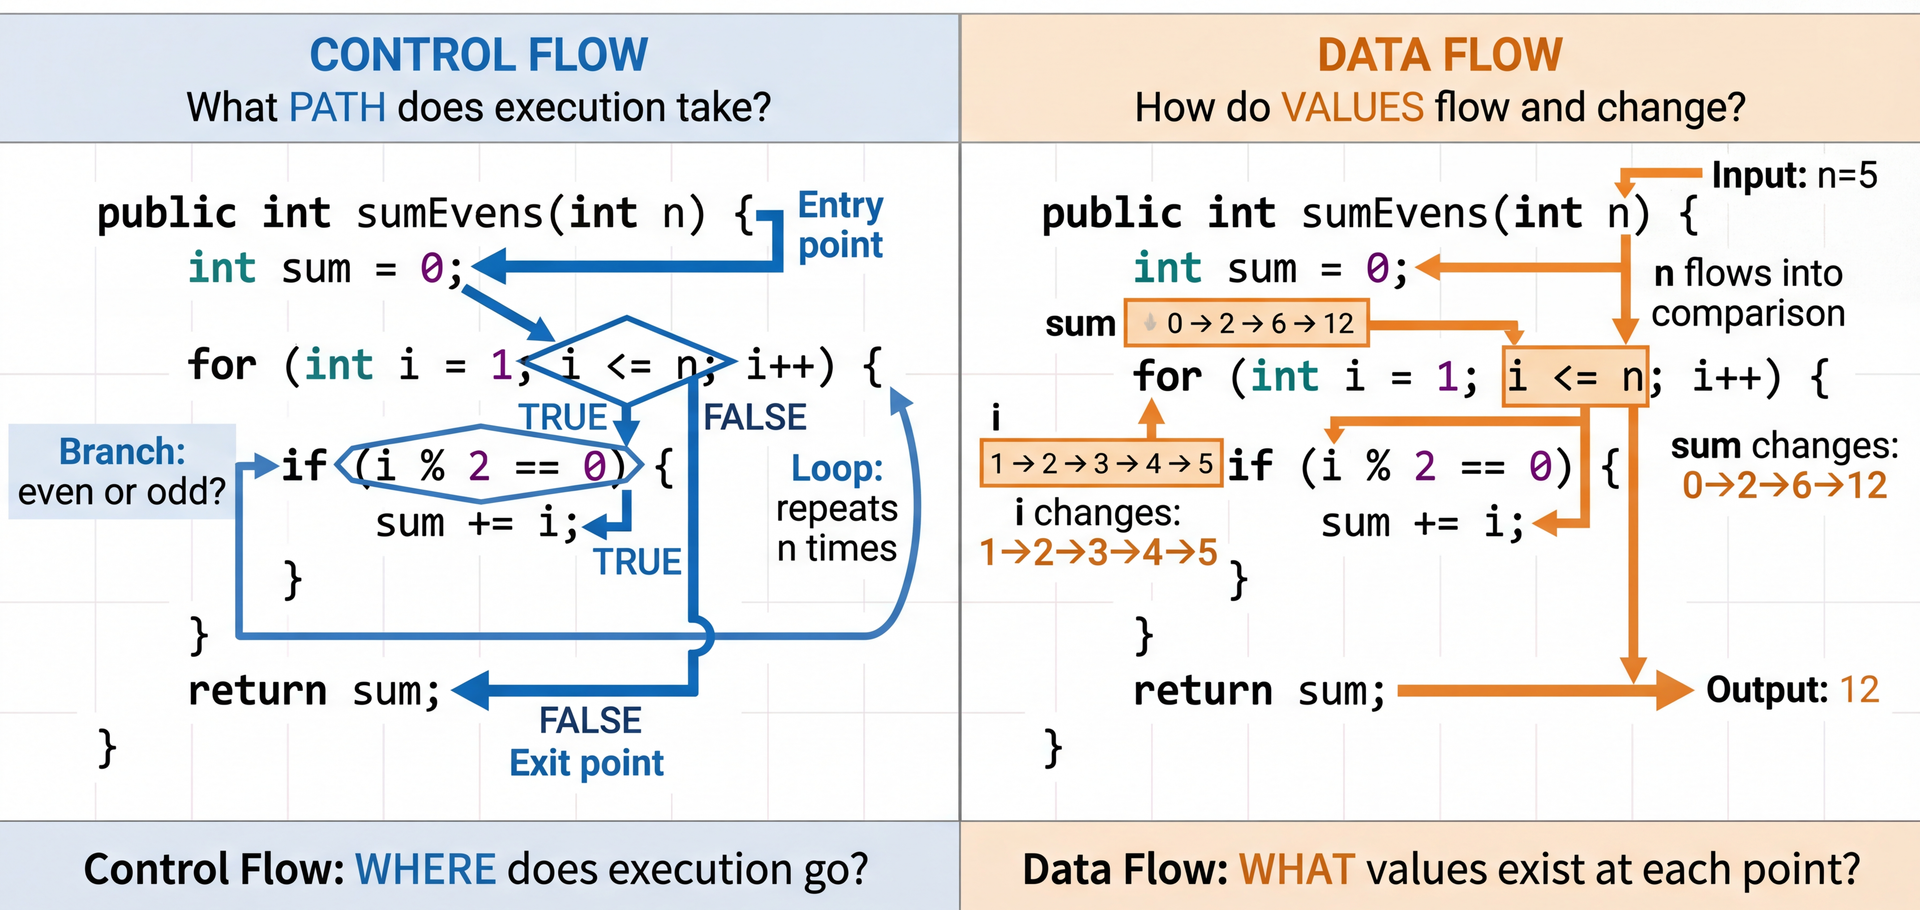
Two Lenses for Understanding Code The two-lens metaphor:
Same code, two different ways to see it
Control flow: Where does execution GO?
Data flow: What VALUES exist?
Most bugs require seeing BOTH
Why two lenses?
Control flow alone misses: "the right path, but wrong value"
Data flow alone misses: "right value at wrong time"
Combining them reveals the full picture
Connection to L5 Readability:
Good naming makes both lenses clearer
containsRecipe immediately tells you what the branch checksisBlank(author) clearly documents the data transformation → Transition: Let's look at each lens in detail...
Control Flow: Tracing Execution Paths @Override public Cookbook addRecipe ( Recipe recipe ) { if ( containsRecipe ( recipe . getId ( ) ) ) { throw new IllegalArgumentException ( "Recipe with ID '" + recipe . getId ( ) + "' already exists" ) ; } List < Recipe > newRecipes = new ArrayList < > ( recipes ) ; newRecipes . add ( recipe ) ; return new CookbookImpl ( id , title , newRecipes , author , isbn , publisher , publicationYear ) ; }
Questions to ask: Which paths are possible? What happens if the recipe ID already exists? What happens on the "happy path"?
This is code from A3 you'll work with this week!
Reading control flow:
Identify branch points: containsRecipe check
Path 1: Recipe exists → exception thrown (error path)
Path 2: Recipe doesn't exist → add to list, return new cookbook (happy path)
Why this matters for A3:
This demonstrates immutability: returns NEW cookbook, doesn't modify existing
The duplicate check prevents bugs from having two recipes with same ID
Understanding this helps you implement PersonalCollectionImpl and WebCollectionImpl
Common control flow bugs:
Forgetting the duplicate check → silent data corruption
Missing the "return new instance" → accidentally mutating
Not preserving other fields (author, isbn, etc.) when creating new instance
→ Transition: Now let's look at data flow...
Data Flow: Tracking How Values Change @JsonCreator private CookbookImpl ( @JsonProperty ( "id" ) @Nullable String id , @JsonProperty ( "title" ) String title , @JsonProperty ( "recipes" ) List < Recipe > recipes , @JsonProperty ( "author" ) @Nullable String author , @JsonProperty ( "isbn" ) @Nullable String isbn , @JsonProperty ( "publisher" ) @Nullable String publisher , @JsonProperty ( "publicationYear" ) @Nullable Integer publicationYear ) { this . id = ( id != null ) ? id : UUID . randomUUID ( ) . toString ( ) ; this . title = title ; this . recipes = List . copyOf ( recipes ) ; this . author = isBlank ( author ) ? null : author ; this . isbn = isBlank ( isbn ) ? null : isbn ; this . publisher = isBlank ( publisher ) ? null : publisher ; this . publicationYear = publicationYear ; }
Questions to ask: What happens if author = " " (whitespace)? Trace how the data flows through isBlank() to this.author.
This is code from A3! Understanding this data flow helps debug serialization issues.
Reading data flow:
Track where variables are DEFINED: constructor parameters → fields
Track transformations: isBlank(author) changes data in transit
Consider ALL possible values: null, blank string, valid string
The normalization pattern:
Input: author could be null, "", " ", or "Julia Child"
Flow: isBlank(author) ? null : author
Result: blank strings become null (so getAuthor() returns Optional.empty())
Why? Consistent representation: "not specified" is always null, never blank string
Why this matters for A3:
Jackson deserializes JSON → calls this constructor with @JsonCreator
The @JsonProperty annotations tell Jackson which JSON fields map to parameters
You'll use this same pattern for PersonalCollectionImpl and WebCollectionImpl
Common data flow bugs in serialization:
Forgetting defensive copy → mutable collections leak out
Not normalizing blank strings → inconsistent Optional behavior
Missing null checks before calling methods
→ Transition: Let's see how control and data flow combine...
Combining Control and Data Flow Analysis public List < Recipe > findRecipesByTitle ( String title ) { return collections . stream ( ) . flatMap ( c -> c . getRecipes ( ) . stream ( ) ) . filter ( r -> r . getTitle ( ) . equalsIgnoreCase ( title ) ) . toList ( ) ; }
Real bugs often involve both control and data flow issues interacting.
This is code YOU'LL implement for A3!
The interplay of control and data flow:
Control flow: Stream operations create a pipeline of transformations
stream() → flatMap() → filter() → toList() is the execution pathEach operation processes elements in sequence
Data flow: The title parameter flows through the entire pipeline
Read from parameter → flows into equalsIgnoreCase() for each recipe
Recipe objects flow from collections → through flatMap → through filter → into result list
Why this is safe:
collections is immutable (from List.copyOf() in constructor)Can't be modified during iteration → no ConcurrentModificationException
Each recipe's title is also immutable → consistent comparisons
Common bugs to watch for:
Forgetting case-insensitive comparison → equals() instead of equalsIgnoreCase()
Not handling null title → should add null check at method entry
Accidentally mutating collections during iteration (prevented by immutability here!)
Connection to L5 Readability:
Stream operations make control flow explicit and linear
Method name findRecipesByTitle clearly documents what data flows in/out
→ Transition: For complex code, we need visualization tools...
Interprocedural Analysis: Following Calls Across Methods
When examining control flow, you may need to trace across method boundaries:
IDE Tools:
Find All References : Where is this method called?Go to Definition : What does this method do?Call Hierarchy : Who calls whom? Visualization:
Call graphs : Static view of what CAN call whatSequence diagrams : Dynamic view of what DID happen
These tools become essential as codebases grow beyond what you can hold in your head.
Why interprocedural matters:
Bug might be in the CALLER, not the method you're looking at
State might be set elsewhere and just manifests here
Understanding requires seeing the bigger picture
IDE tools are your friends:
IntelliJ: Ctrl+Click for definition, Alt+F7 for usages
VS Code: F12 for definition, Shift+F12 for references
These should become muscle memory
When to use visualization:
When you can't hold the call structure in your head
When explaining to others
When debugging complex interactions
→ Transition: But there's a catch with OO code...
Don't Forget: Dynamic Dispatch Affects Control Flow
From A3: When you see collection.addRecipe(recipe), which addRecipe runs?
⚠️ Recall from Quiz 1: The runtime type determines which method executes, not the declared type!
This is the A3 collection hierarchy you'll implement!
This was tricky on Quiz 1!
Many students struggled with dynamic dispatch questions
Static analysis shows what COULD be called
Runtime behavior depends on actual object type
When tracing control flow in A3:
RecipeCollection collection = repository.findById(id).get(); — declared type is RecipeCollectioncollection.addRecipe(recipe) — but which addRecipe?Depends on runtime type: CookbookImpl? PersonalCollectionImpl? WebCollectionImpl?
Each returns its own specific type (Cookbook, PersonalCollection, WebCollection)
Why this matters for serialization:
Jackson uses @JsonTypeInfo to add a "type" field in JSON
When deserializing, Jackson reads "type": "cookbook" and creates CookbookImpl
Dynamic dispatch ensures the right addRecipe implementation runs
This is why polymorphic serialization is crucial!
Debugging implication:
Can't always know statically which method runs
Use debugger to see actual runtime type
Or check the JSON file to see "type" field
Key skill: When "Go to Definition" shows RecipeCollection interface, remember to check which implementation is actually being used at runtime.
→ Transition: Diagrams can help visualize these relationships...
Diagrams Help You See the Big Picture
Complex systems require visualization . Three key diagram types:
Diagram Type Shows Use When Call Graph Which methods call which Understanding static structure Sequence Diagram Order of calls over time Understanding dynamic behavior Class Diagram Relationships between types Understanding data model
Why diagrams matter:
Code is linear; systems are not
Diagrams show relationships at a glance
Hand-sketching is often fastest while debugging—formalize later for documentation Mermaid for formal diagrams:
Text-based, version control friendly
AI can generate and modify diagrams for you
Great for documentation and collaboration
→ Transition: Let's see examples...
Call Graphs: Static View of Method Relationships
From A3: JSON serialization involves many method calls under the hood. Understanding this call graph helps debug serialization issues.
This is the A3 JSON serialization flow!
What call graphs reveal:
Entry point: save(collection) in your repository implementation
Jackson's ObjectMapper does the heavy lifting
@JsonTypeInfo annotation adds type discriminationPolymorphic serialization: Jackson must figure out concrete types
Is this Ingredient a MeasuredIngredient or VagueIngredient?
Is this Quantity an ExactQuantity, FractionalQuantity, or RangeQuantity?
Finally writes to file via Files.writeString()
Why this matters for debugging:
If JSON is missing a field → check if getter exists
If JSON has wrong type → check @JsonTypeInfo annotations
If serialization fails → check which object in the graph is problematic
Understanding the call flow helps you identify where things break
How to create:
Start with the entry point (save)
Add direct calls as arrows
Highlight key decision points (polymorphism in blue)
Jackson internals (green) vs your code (starting point)
The Mermaid syntax:
graph LR = left-to-right flowA[text] = node with labelA --> B = arrow from A to Bstyle B fill:#color = highlight node → Transition: Sequence diagrams show the ORDER of execution...
Sequence Diagrams: Dynamic View Over Time This is the A3 JSON round-trip sequence!
What sequence diagrams reveal:
The ORDER of method calls (top to bottom = time)
SAVE operation:
Test calls save(cookbook)
Repository uses Jackson to serialize: writeValueAsString()
Jackson adds type info via @JsonTypeInfo
Result written to file via Files.writeString()
LOAD operation:
Test calls findById(id)
Repository reads file via Files.readString()
Jackson deserializes: readValue(json, RecipeCollection.class)
Jackson reads "type": "cookbook" field and creates CookbookImpl
Returns as Optional<RecipeCollection>
Key insight:
The "type" field is CRITICAL for polymorphism
Without it, Jackson wouldn't know to create CookbookImpl vs PersonalCollectionImpl
This is why @JsonTypeInfo and @JsonSubTypes are essential
When to use sequence diagrams:
Debugging serialization issues: "Where in this sequence did it fail?"
Understanding round-trip behavior: "Does the loaded object equal the saved one?"
Clarifying Jackson's role: "What does the library do vs what we do?"
The Mermaid syntax:
participant X = declare an actorA->>B: message = synchronous callA-->>B: response = return/responseNote over = add annotations → Transition: Class diagrams show data relationships...
Class Diagrams: Understanding the Data Model This is the core A3 data model!
What class diagrams reveal:
RecipeCollection: Interface with id, title, list of recipes
Methods return NEW collections (immutability)
Recipe: Has ingredients, instructions, optional servingsIngredient: Abstract base class (MeasuredIngredient and VagueIngredient extend it)Quantity: Also abstract (ExactQuantity, FractionalQuantity, RangeQuantity) Key relationships:
"1" --> "*" = one-to-many: One collection contains many recipes"1" --> "*" = one-to-many: One recipe has many ingredients"1" --> "0..1" = optional: Recipe may have servings (or not) When to use class diagrams:
Understanding domain model structure
Seeing containment relationships (what holds what?)
Planning implementations: "What fields do I need?"
Debugging: "Where should this data live?"
Why this matters for A3:
You need to serialize/deserialize this entire object graph
Jackson handles nested objects automatically
Understanding the structure helps debug JSON issues
When JSON is missing data, check: "Which relationship broke?"
The symbols:
<<interface>> = interface (not concrete class)<<abstract>> = abstract class--> = association (has-a)Numbers = multiplicity (how many)
→ Transition: Let's talk about practical Mermaid usage...
Practical Diagram Workflow When debugging, sketching quick ASCII art (or gasp paper and pencil) is fastest:
Test -> JsonRecipeCollectionRepository.save(cookbook)
  Repo -> ObjectMapper.writeValueAsString()
    -> adds "type": "cookbook"
    -> serializes Recipe[]
  Repo -> Files.writeString() ⚠️ IO Exception?
Faster than looking up syntax
Forces you to understand flow
Easy to annotate with hypotheses
Hand-sketch while debugging (fast, flexible)
Key message: Don't memorize syntax—use references and AI. Focus on WHAT to diagram, not HOW.
→ Transition: Let's see concrete examples of using AI for diagram generation...
Using AI to Generate Diagrams: Concrete Examples Example 1: Visualizing classes relating to CookbookImpl
Prompt: "Create a class diagram with CookbookImpl and all classes it has relationships with." Example 2: Understanding CookbookImpl construction flow
Prompt: "Create a sequence diagram showing how CookbookImpl is created from JSON
using Jackson."
Example 3: Tracing data flow through UserLibraryImpl
Prompt: "Show the data flow when UserLibraryImpl.findRecipesByTitle()
searches across collections."
✅ Great use of AI: Quickly get the benefits of visualization.
Tip: Use mermaid.live for live editing
It's great to use AI to increase your understanding through:
Class diagrams
Complex multi-step flows (Jackson serialization)
Stream pipelines (multiple transformations)
Call sequences across multiple methods
When you need formal documentation
AI saves time on:
Mermaid syntax (you don't need to memorize it)
Consistent formatting
Iterating on the diagram structure
But YOU must:
Verify the diagram is correct
Check it matches the actual code
Understand what each step does
→ Transition: But when should you NOT use AI?
When to Use the IDE, Not AI ❌ Don't use AI to:
find a method's javadoc
go to an implementation
find where a method is called
Use the IDE!
IDE navigation is ALWAYS faster for simple lookups
Go to definition, find usages, type hierarchy are instant and accurate
Don't use AI when reading the code is faster
Transition: So when SHOULD you use AI?
When to Use AI for Diagrams ✅ Use AI for:
Complex call chains: Multiple methods across classes
"Show how save() calls Jackson which calls getters"
Understanding polymorphism:
"Diagram the RecipeCollection hierarchy and show which addRecipe runs for each type"
Stream pipelines:
"Visualize the data transformations in findRecipesByTitle"
Documenting for others:
AI generates shareable Mermaid diagrams
You validate them, others can trust them
Use AI for complex flows you haven't seen before
Use AI for formal diagrams for documentation or team discussion
Use AI to save time on Mermaid syntax
But ALWAYS verify AI output against actual code
Transition: Let's see what effective AI prompts look like
AI Generated This Diagram. Now What? Prompt used:
"I'm working on implementing JsonRecipeCollectionRepository. Create a mermaid sequence
diagram showing the save() method, from here to disk."
Pause here and ask students: "What would you do with this?"
Key points to draw out:
Verify against actual code:
Does it call writeValueAsString() or something else?
Is the @JsonTypeInfo behavior correct?
Check the actual implementation—AI may have hallucinated details
Test your understanding:
Can you explain each step?
Do you know WHY @JsonTypeInfo is needed?
What would break if you removed it?
Iterate if wrong:
"This diagram shows X, but the actual code does Y. Please fix it."
Include the actual method signature if AI hallucinated
The meta-lesson: AI can generate impressive-looking diagrams, but YOU must verify them. The diagram is only useful if it's accurate AND you understand it.
Why this prompt is effective:
Specific context: "A3's JsonRecipeCollectionRepository" (not generic)Numbered steps: Clear what to includeMentions key concepts: @JsonTypeInfo, polymorphismSpecifies format: Mermaid sequence diagram with named participantsPurpose-driven: Understanding serialization flow Common mistakes to avoid:
❌ "Make a diagram of my code" → too vague
❌ Pasting 500 lines of code → AI will summarize poorly
❌ Accepting diagram without verification → might be wrong
❌ Using AI for simple lookups → IDE is faster
The verification step is CRITICAL:
AI might hallucinate method names
AI might not know about @JsonTypeInfo if not told
AI might oversimplify complex logic
YOU are responsible for correctness
Real A3 scenario:
You're confused about polymorphic serialization
AI helps you visualize the flow
You verify against CookbookImpl's annotations
Now you understand how to implement PersonalCollectionImpl
→ Transition: Let's compare good vs bad AI usage...
AI for Diagrams: What Works vs What Doesn't ❌ Vague: "Diagram the repository pattern"
No diagram type (sequence? class?)
No format → ASCII art 🤮
Generic, not your code
✅ Specific: "Create a mermaid flowchart showing data flow through CookbookImpl constructor"
Diagram type ✓ Format ✓ Your class ✓
❌ Wrong tool: "What does addRecipe do?"
AI reads code, explains it
You could just read it yourself
Slower than Ctrl+Click
✅ Right tool: Press F12 on addRecipe
Instant definition
See params and return type
Can step through in debugger
Key lessons:
For AI prompts:
✅ Be specific: mention class names, method names, annotations
✅ Describe what you want to understand (the WHY)
✅ Specify the diagram type (sequence, class, flow)
❌ Don't be generic: "explain this code"
❌ Don't paste huge code blocks without context
Tool selection:
IDE navigation (instant): Go to definition, find usages, type hierarchyHand sketching (fast): Quick flow while debuggingAI diagrams (formal): Complex flows, documentation, sharing The meta-skill:
Knowing WHEN to use each tool is as important as knowing HOW
Use AI to amplify your understanding, not replace it
Always verify AI output against actual code
A3 specific examples:
❌ AI: "What fields does Recipe have?" → Just open Recipe.java
✅ AI: "Diagram how Recipe with nested Ingredients serializes to JSON"
❌ AI: "Where is Cookbook used?" → IDE Find Usages
✅ AI: "Show the call sequence when deserializing polymorphic collections"
→ Transition: Now that we can visualize effectively, let's learn systematic debugging...
Debugging Is Critical Thinking Applied to Code
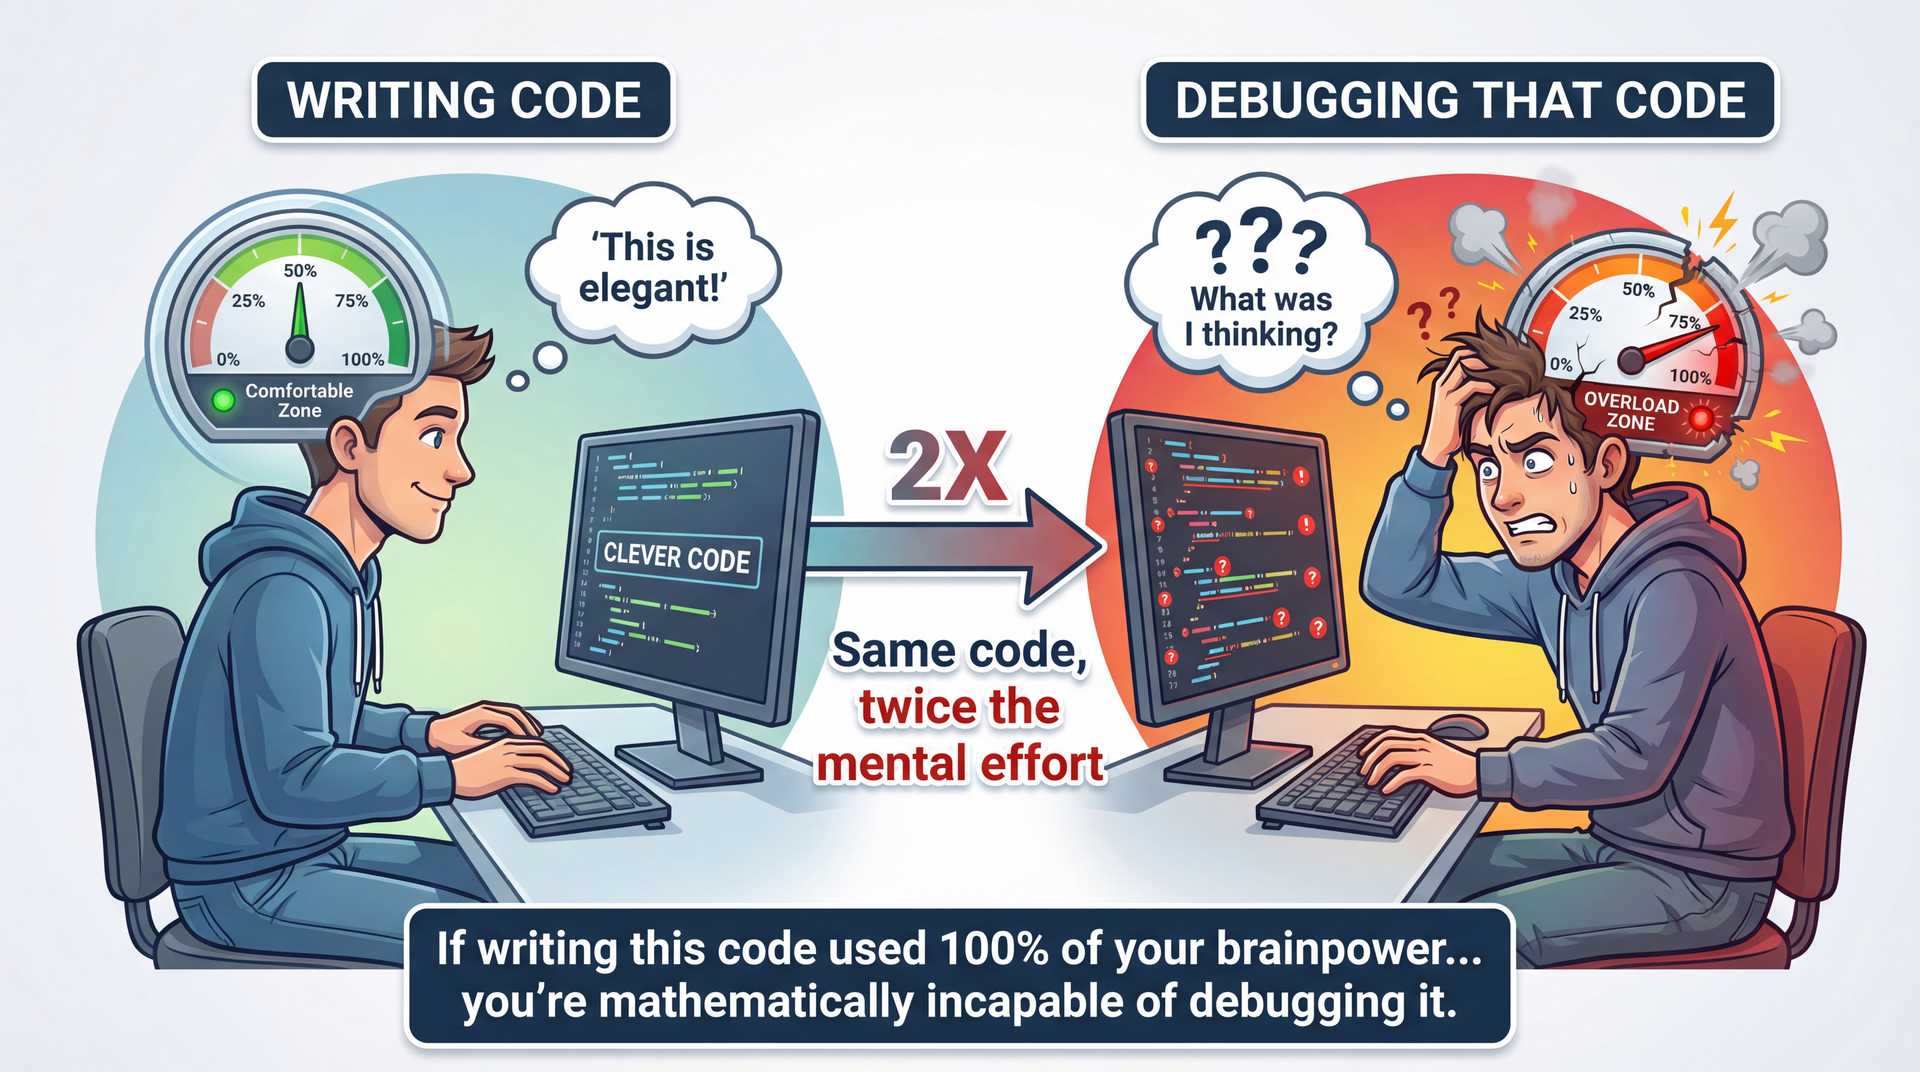
"Debugging is twice as hard as writing the code in the first place. Therefore, if you write the code as cleverly as possible, you are, by definition, not smart enough to debug it." — Brian Kernighan
The Kernighan quote:
Debugging requires understanding what you wrote
Plus understanding what went wrong
If code is at your limit, debugging exceeds it
Connection to L5 Readability:
This is WHY readability matters so much
Readable code is debuggable code
"Clever" code becomes debugging nightmare
The mindset shift:
Debugging isn't about being "smart enough"
It's about being SYSTEMATIC
Same skills as scientific inquiry: hypothesize, test, learn
→ Transition: Let's see what the scientific method looks like for debugging...
The Scientific Method Applied to Debugging
Observe: Notice unexpected behavior or test failureHypothesize: Form a theory about the causePredict: What evidence would support or refute this?Test: Gather evidence (debugger, logging, tests)Analyze: Does the evidence support the hypothesis?Iterate: Refine hypothesis or implement fixQuick Background: What Is HTML?
HTML uses tags (text in angle brackets) to format web pages:
HTML (what you write):
< b > Hello </ b > world < p class = " intro " > Welcome! </ p > Rendered (what users see):
Hello world
Welcome!
The task: Write a function that extracts just the text, removing all tags.
Input Expected Output <b>Hello</b>HelloClick <a href="url">here</a>Click here
Quick HTML primer:
Tags are surrounded by < and >
Opening tag: <b> (start bold)
Closing tag: </b> (end bold)
Tags can have attributes: <a href="url"> — note the quotes inside!
Why this matters for the example:
We need to recognize when we're INSIDE a tag (between < and >)
We need to handle quotes in attributes (don't treat < inside quotes as a tag start)
The bug we'll find is subtle but common
If students aren't familiar with HTML:
That's fine! The key is: <stuff> = tag to remove, everything else = keep
The complexity comes from quotes inside tags
→ Transition: Now let's see the code that tries to do this...
Example: Debugging HTML Markup Removal public static String removeHtmlMarkup ( String s ) { boolean tag = false , quote = false ; StringBuilder out = new StringBuilder ( ) ; for ( int i = 0 ; i < s . length ( ) ; i ++ ) { char c = s . charAt ( i ) ; if ( c == '<' && ! quote ) { tag = true ; } else if ( c == '>' && ! quote ) { tag = false ; } else if ( c == '"' || c == '\'' && tag ) { quote = ! quote ; } else if ( ! tag ) { out . append ( c ) ; } } return out . toString ( ) ; }
Adapted from Andreas Zeller's "Introduction to Debugging" (CC-BY-NC-SA).
Step 1: Observe — Build an Observation Table Input Expected Actual Result <b>foo</b>foofoo✓ <b>"foo"</b>"foo"foo✗ "<b>foo</b>""foo"<b>foo</b>✗ <b id="bar">foo</b>foofoo✓
Both failures involve quotes. Pattern emerging!
Why no code on this slide? Intentional! At this point we're focusing on patterns in input/output , not trying to spot the bug by staring at code. The observation table IS the technique—we let the data guide us to hypotheses.
Building the table:
Test with simple cases first
Include edge cases (quotes in content, quotes around tags)
Record EXACTLY what happens
What we observe:
Basic tag removal works: <b>foo</b> → foo
But quotes cause problems in two different ways
These might be related or separate bugs
Key practice: Write down observations before forming theories. Our brains want to jump to conclusions—resist!
→ Transition: Step 2—let's form hypotheses...
Based on our observations, we form two hypotheses:
Hypothesis Based On H1: Double quotes are stripped from output<b>"foo"</b> → foo (quotes missing)H2: Quotes outside tags break tag parsing"<b>foo</b>" → <b>foo</b> (tags kept)
Let's focus on H1 first—it's simpler. We'll refine it:
H1 (refined): Double quotes are stripped from input, even without tags.
Why start with H1:
Simpler to test
May explain H2 as well (related to quote handling)
Start simple, add complexity if needed
The refinement:
Original: "quotes stripped from tagged input"
Refined: "quotes stripped from ALL input"
This is a stronger, more testable claim
Key practice: Make hypotheses SPECIFIC and TESTABLE.
→ Transition: Step 3—let's test this hypothesis...
Step 3 & 4: Predict and Test
Prediction: If H1 is correct, even "foo" (no tags) should lose its quotes.
@Test public void testPlainQuotes ( ) { assertEquals ( "\"foo\"" , removeHtmlMarkup ( "\"foo\"" ) ) ; } Input Expected Actual Result "foo""foo"foo✗
H1 CONFIRMED: Double quotes are stripped even without any HTML tags.
The test:
We predicted quotes would be stripped without tags
We tested with just "foo" (no tags at all)
The prediction was correct—quotes ARE stripped
Why this matters:
We now know the bug isn't about tag handling specifically
It's about quote handling in general
This narrows our focus
Key practice: Make predictions that could REFUTE your hypothesis. If you can only confirm, you're not testing rigorously.
→ Transition: Let's dig deeper into WHY this happens...
Step 5: Analyze — Narrow Down the Cause Where is quote-stripping happening? The only quote-handling code is:
else if ( c == '"' || c == '\'' && tag ) { quote = ! quote ; } This should only trigger when tag is true. But for input "foo", there are no tags, so tag should always be false...
New hypothesis H3: The error is due to tag being set incorrectly.
for ( int i = 0 ; i < s . length ( ) ; i ++ ) { char c = s . charAt ( i ) ; assert ! tag ; }
H3 REFUTED: tag is always false, yet quotes are still stripped.
The investigation:
We identified the suspicious code
We formed hypothesis H3: tag is being set wrong
We tested with an assertion
H3 was REFUTED—tag is never true
What this tells us:
The bug isn't in tag-setting logic
The quote condition is triggering when it shouldn't
But HOW? If tag is false, shouldn't the condition be false?
Key practice: Use assertions to test assumptions. When they pass/fail, you learn something.
→ Transition: If tag is false, why does the condition trigger?
Step 5 (continued): The Root Cause Revealed
New hypothesis H4 : The quote condition evaluates to true even when tag is false.
else if ( c == '"' || c == '\'' && tag ) { assert false ; quote = ! quote ; }
H4 CONFIRMED. But wait—let's test with single quotes:
removeHtmlMarkup ( "'foo'" ) ;
Double quotes are stripped. Single quotes are preserved. The difference?
Operator precedence! c == '"' || c == ''' && tag is parsed as(c == '"') || (c == ''' && tag)
Step 6: Fix — Implement and Verify Before (buggy):
else if ( c == '"' || c == '\'' && tag ) { quote = ! quote ; } Parsed as:
(c == '"') || (c == '\'' && tag) After (fixed):
else if ( ( c == '"' || c == '\'' ) && tag ) { quote = ! quote ; } Parsed as:
(c == '"' || c == '\'') && tag
✓ All tests now pass. The bug was operator precedence—parentheses fix it.
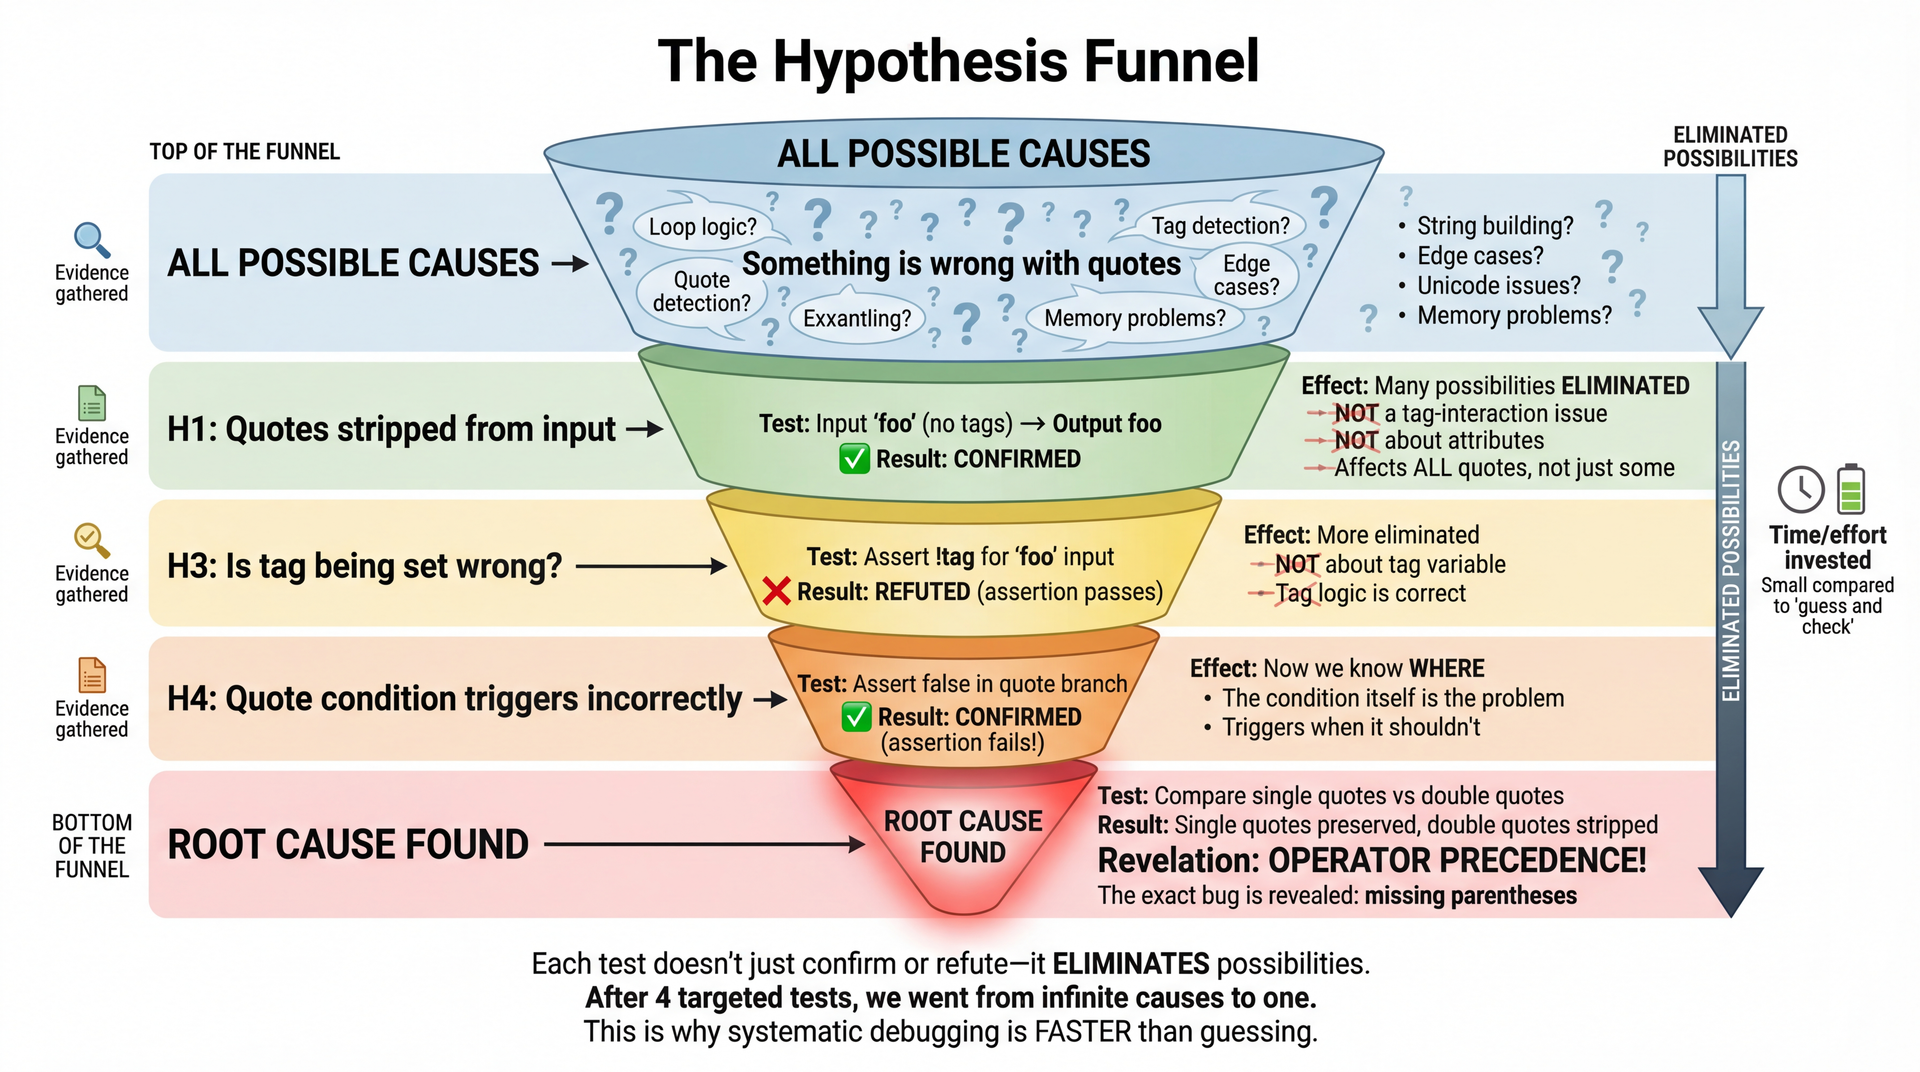
The Hypothesis Funnel: How We Narrowed Down the Bug
4 targeted tests took us from "something is wrong" to "operator precedence bug."
The power of systematic debugging:
We didn't guess randomly
Each test ELIMINATED possibilities
H1: Confirmed it's a quote issue (not tags)
H3: Ruled out tag variable (refuted)
H4: Confirmed the condition is wrong
Generalization: Single vs double quotes revealed precedence
Why this is faster:
4 targeted tests vs potentially dozens of random changes
Each test gives INFORMATION even when it fails
We converged on the exact bug
The takeaway:
Systematic doesn't mean slow
It means efficient—maximum information per test
→ Transition: Let's talk about when to use this approach...
When to Use Systematic Debugging Quick Fixes (1-2 tries):
Obvious typos
Simple logic errors
Familiar patterns
Just fix it.
Systematic Approach:
Bug persists after a few attempts
You don't understand the root cause
Complex interactions involved
Open a debugging log.
Rule of thumb: If you can't fix it in two tries, start writing down your hypotheses. The log helps when you think "but I already checked that!"
Tighten feedback loops:
If you keep reproducing the bug, create a minimal test case
Don't spend more time reproducing than debugging
But don't over-engineer the test case either
The debugging log:
Plain text file
Record hypotheses and outcomes
Prevents going in circles
Helps you resume after breaks
When systematic pays off:
Complex bugs that span multiple sessions
Bugs in unfamiliar code
When you're confused and frustrated
→ Transition: Let's see why the log matters so much...
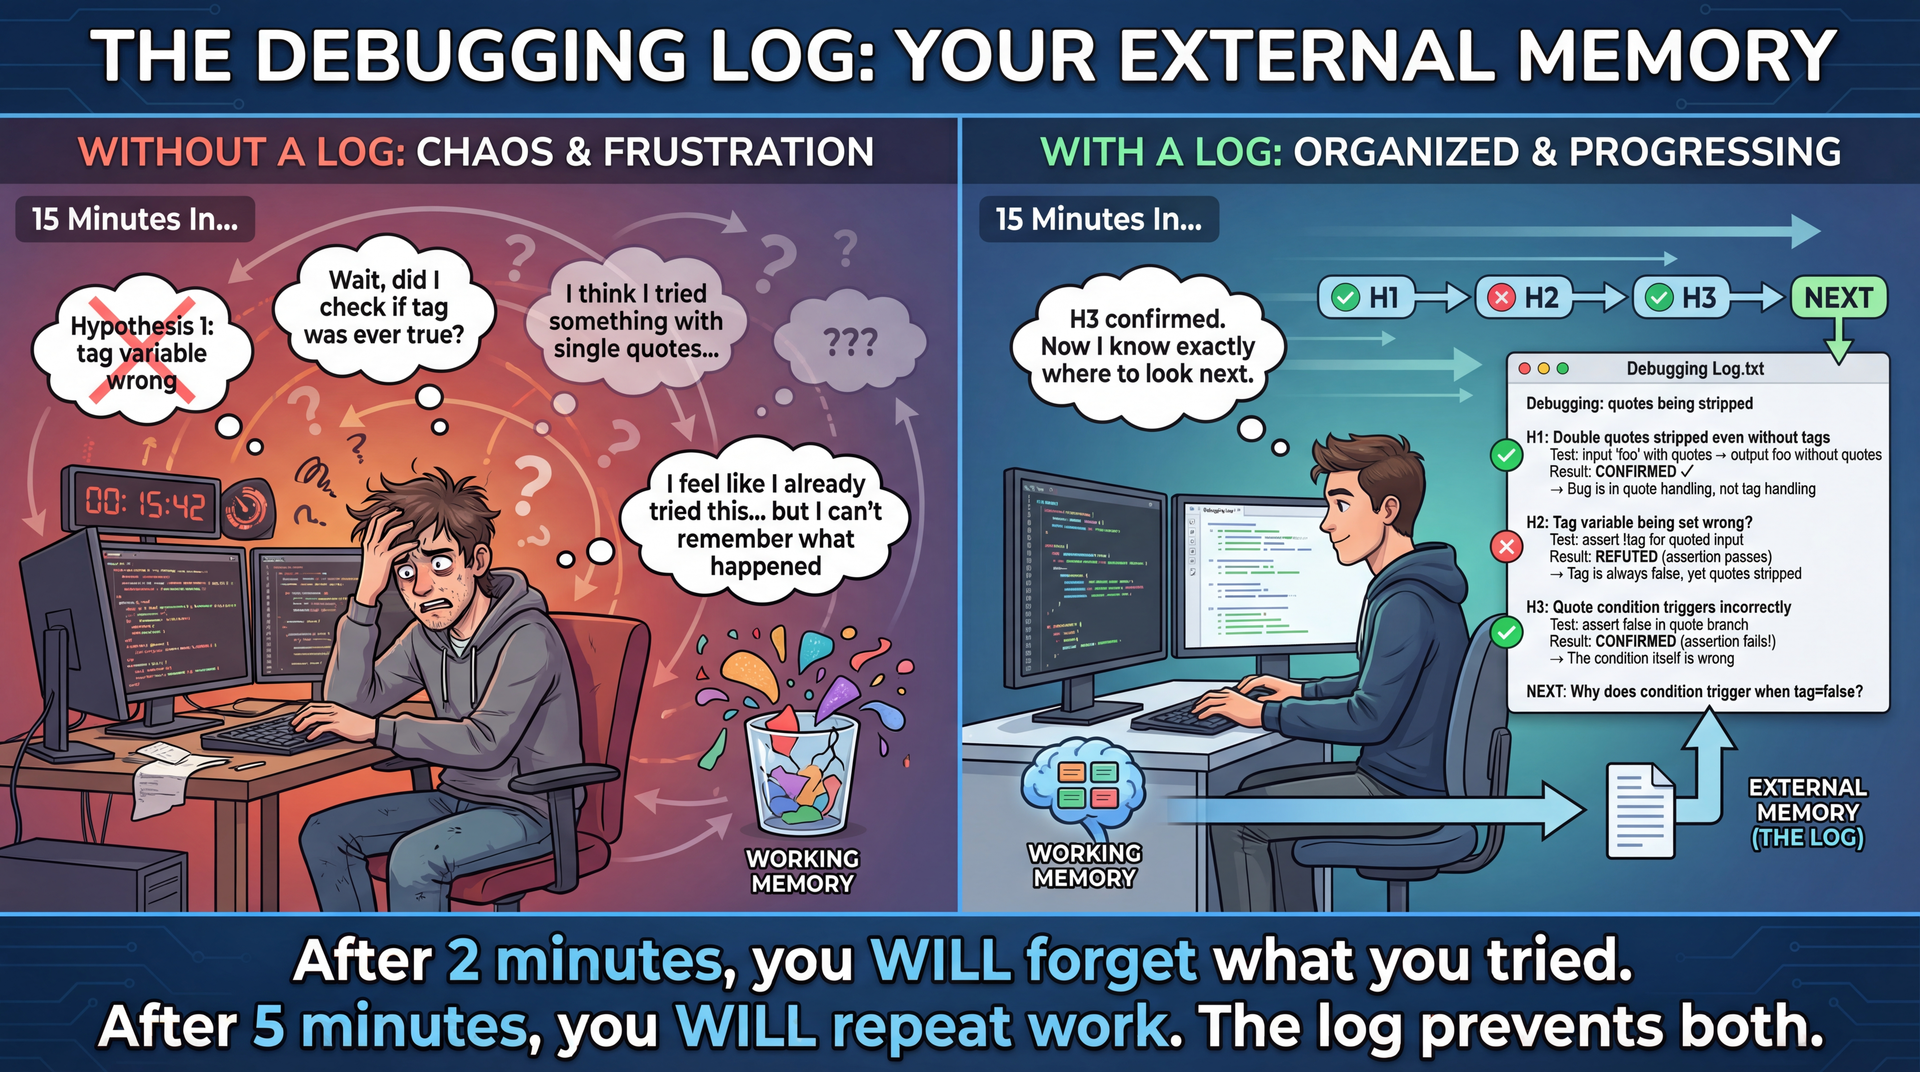
Why Keep a Debugging Log? The science behind this:
Working memory holds roughly 4 items at once
Each hypothesis, test, and observation is an "item"
A 15-minute debug session easily generates 20+ items
Without external storage, you WILL lose information
The practical reality:
"I feel like I already tried this" → you probably did
"Let me just try one more thing" → you're going in circles
"Wait, what did that test tell me?" → lost insight
The log doesn't have to be fancy:
Plain text file, markdown, even paper
Just: hypothesis, test, result, next step
30 seconds to write, saves 5 minutes of repeated work
When students resist:
"It slows me down" → It speeds you up after minute 2
"I can remember" → You can't. Nobody can. That's the point.
"It's overkill for small bugs" → Then you'll fix it in 2 tries and never need the log
→ Transition: Now let's see how debuggers accelerate hypothesis testing...
1. Write an automated test first
You may need to reproduce the bug 100+ times to pinpoint it and confirm the fix
Manual reproduction = slow feedback loop = frustration
A failing test makes each hypothesis test instant
2. Reason through the code (rubber duck debugging)
Explain the code out loud, line by line
"The variable tag starts false, then when we see <..."
Often reveals assumptions you didn't know you were making
3. Add logging statements (cautiously)
Useful when you can't attach a debugger (production, distributed systems)
But: clutters code, requires guessing what to log, noisy output
Remove or use proper logging levels when done
4. Use a debugger ← next slide!
Why automated tests first:
The #1 time sink in debugging is REPRODUCING the bug
If it takes 30 seconds to reproduce manually, and you test 50 hypotheses, that's 25 minutes just clicking around
A test that runs in 100ms means 50 hypotheses = 5 seconds of reproduction time
This is why TDD practitioners often debug faster—they already have the reproduction step automated
Rubber duck debugging:
Named after a programmer who carried a rubber duck and explained code to it
Works because explaining forces you to be explicit about assumptions
Often you'll say "and then X happens" and realize you never verified X actually happens
Can use AI as a rubber duck too: "Let me explain this code to you..."
Logging vs debugger tradeoffs:
Logging: works in production, persists across runs, good for intermittent bugs
Debugger: immediate visibility, no code changes, but requires setup and can't always attach
The key insight:
These tools serve different purposes
Tests = fast reproduction
Rubber duck = surface assumptions
Logging = production/distributed debugging
Debugger = deep inspection
→ Transition: Let's see the debugger in action...
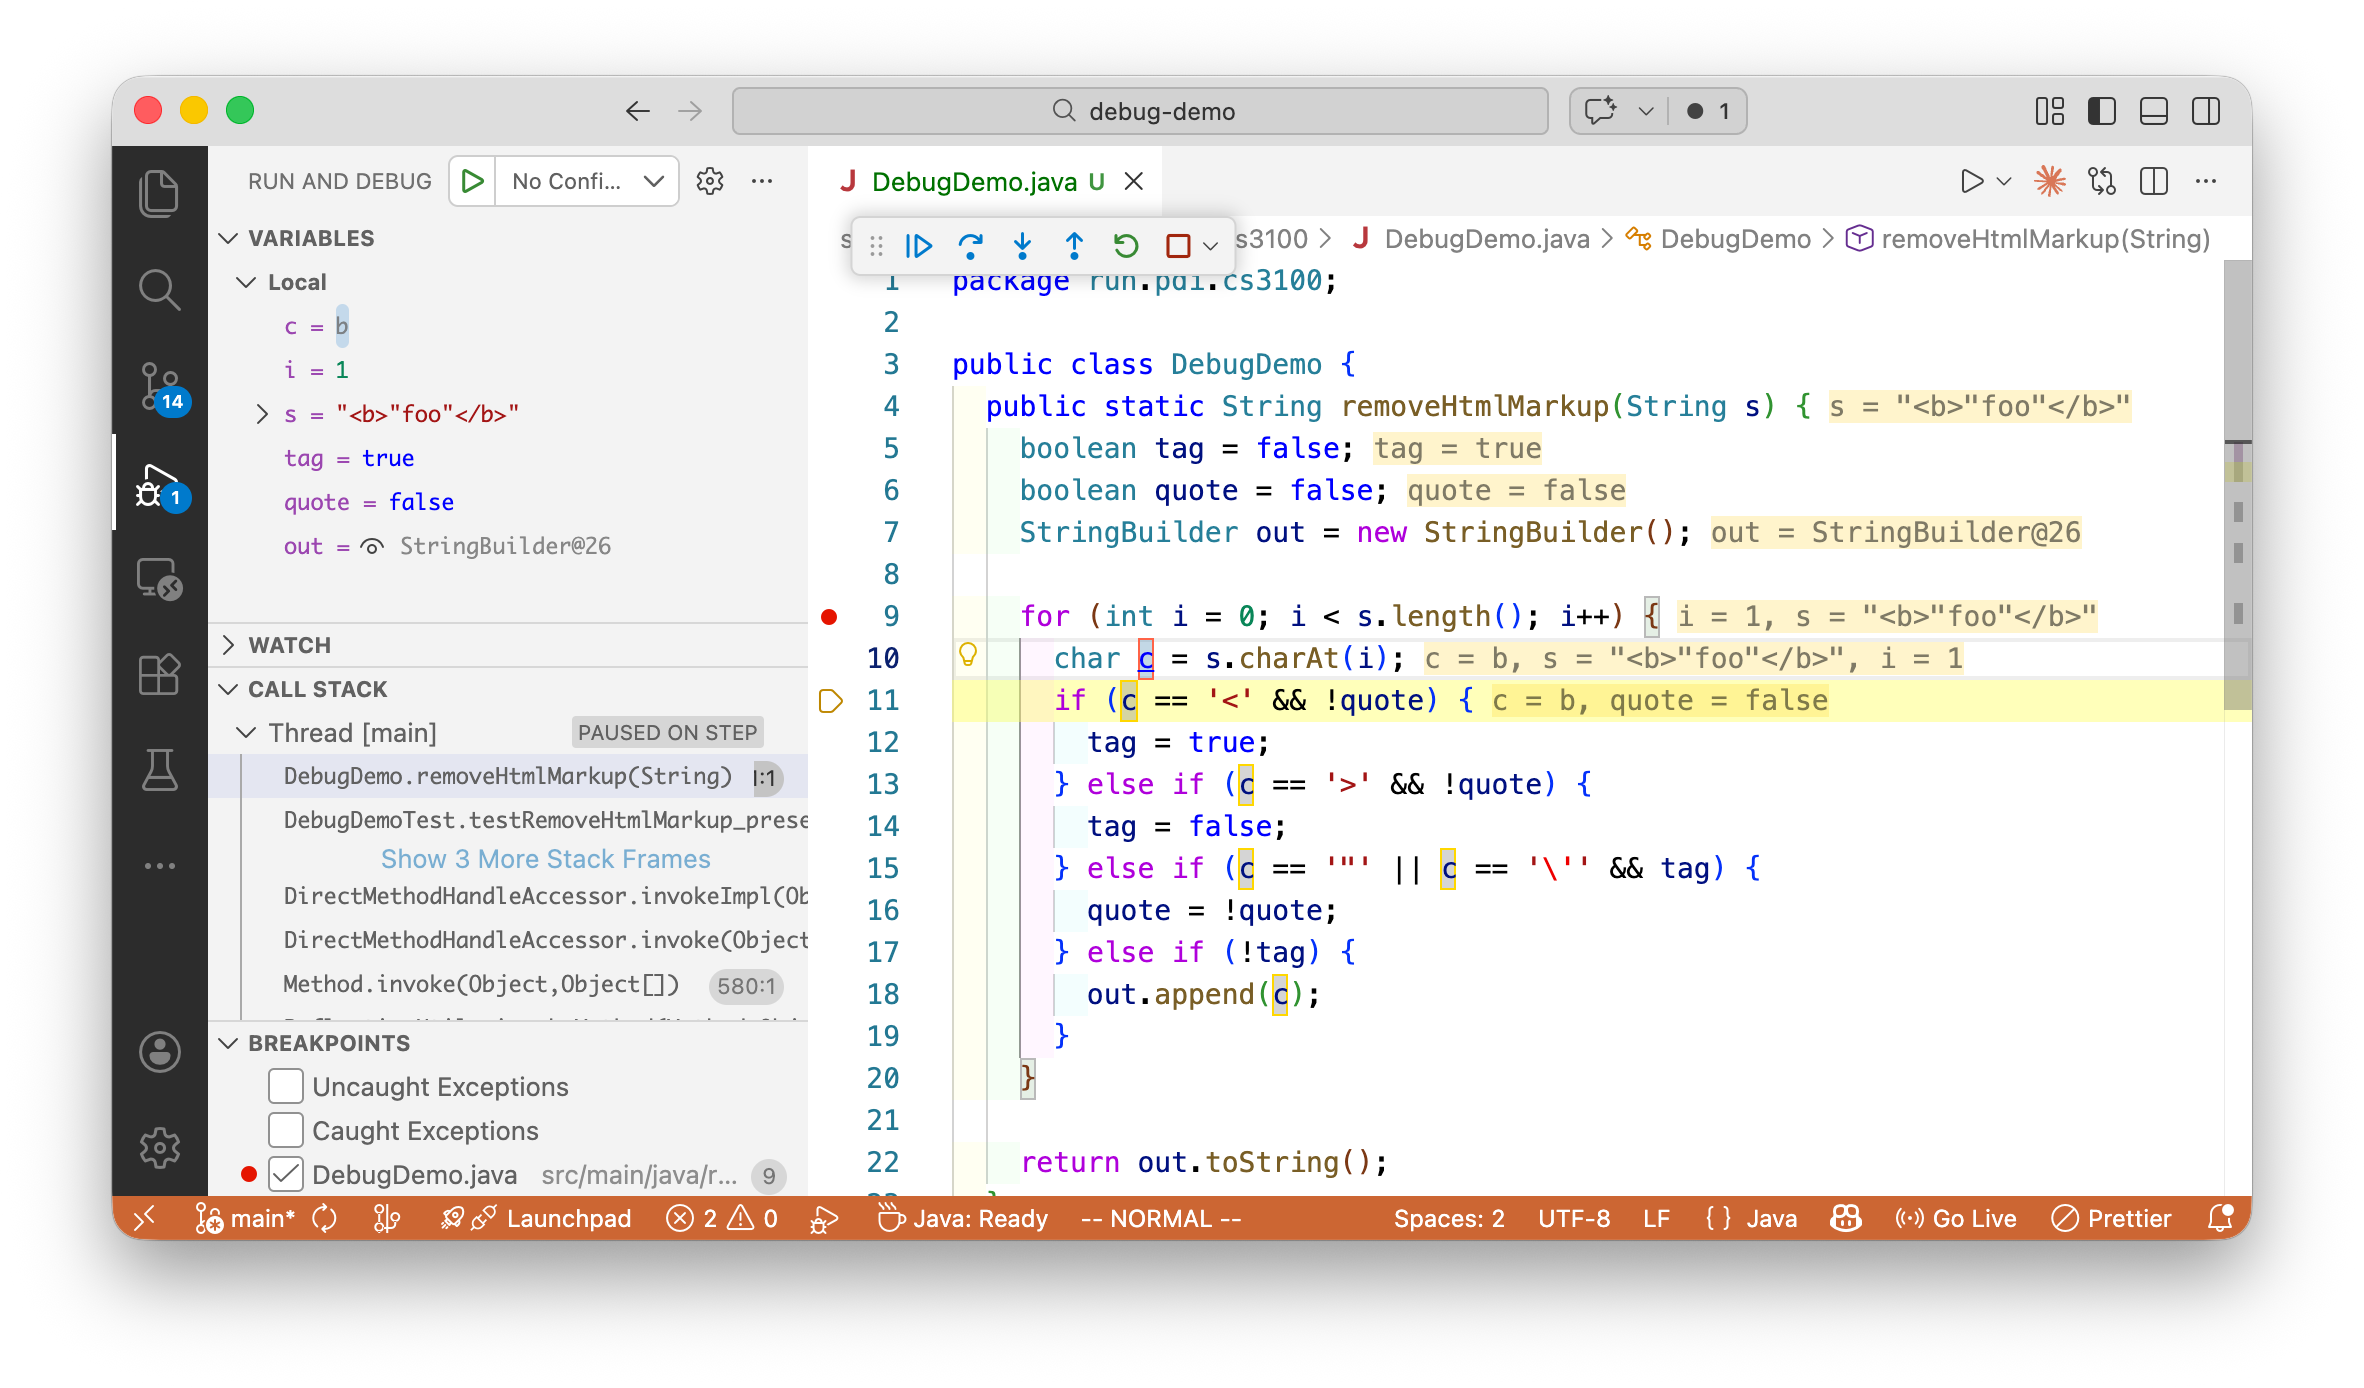
Debugging Our HTML Example Walk through this screenshot:
Set breakpoint where we suspect the bug
Variables panel shows tag, quote, out values
We can see exactly where the state goes wrong
No print statements needed—just inspect
Why debugger beats print statements:
See ALL variables, not just what you guessed to print
Step through one line at a time
No code changes, no recompilation
→ Demo: Step through failing test case "<b>foo</b>"
Debugger = Interactive Hypothesis Testing
Instead of adding print statements and re-running, the debugger lets you test hypotheses interactively :
To Test This Hypothesis... Use This Debugger Feature "Is tag ever true outside a tag?" Conditional breakpoint: tag == true "What is quote when we hit this line?" Watch the quote variable "Does this branch ever execute?" Set breakpoint on that line "What path did execution take?" Check the call stack
The debugger advantage:
No code changes needed
Interactive exploration
See ALL variables at any point
Step through execution in real-time
The debugger doesn't replace thinking:
You still form hypotheses
You still test them
The debugger just makes testing FASTER
→ Transition: Let's review the core debugger concepts...
Core Debugger Concepts Breakpoints:
Line breakpoint: Pause at specific lineConditional: Pause only when condition is trueException: Pause when exception thrown Stepping Commands:
Step Over (F10): Execute line, go to nextStep Into (F11): Enter method callStep Out (Shift+F11): Finish current methodContinue (F5): Run to next breakpoint Inspection:
Variables pane: See all values at current pointWatch expressions: Track specific expressionsCall stack: How did execution get here?Evaluate expression: Test hypotheses interactively The key features:
Breakpoints let you STOP and look around
Stepping lets you follow execution path
Inspection lets you test hypotheses about data
Keyboard shortcuts vary:
IntelliJ, VS Code, Eclipse all slightly different
Learn your IDE's shortcuts—they become muscle memory
The call stack is crucial:
Shows the chain of method calls
Bug might be in CALLER, not current method
Don't ignore it!
→ Transition: Let's see effective debugger workflow...
Effective Debugger Workflow Reproduce reliably — Write a failing test if possibleForm hypothesis — Use control/data flow analysis to guess locationSet strategic breakpoints — Start broad, narrow downStep through systematically — Watch for unexpected values/pathsNote when values first become wrong — That's where the bug manifestsVerify understanding before fixing — Can you explain the bug?
Common pitfall: Stepping through every line. Use conditional breakpoints instead!
Strategic breakpoints:
Don't set a breakpoint and hit F10 100 times
Use conditional breakpoints: i == 47
Use breakpoints at KEY locations, not everywhere
The "first wrong" principle:
Values are correct at some point
Then they become wrong
Finding that transition point finds the bug
Verify before fixing:
Can you explain WHY the bug happens?
If not, you might fix the symptom, not the cause
The scientific method demands understanding
→ Transition: Finally, let's talk about using AI for debugging...
AI + Scientific Debugging Workflow
From L13 , we learned a 6-step workflow for AI collaboration. That same framework applies to debugging—AI can assist at each step of the scientific method, but YOU lead:
Step You Do AI Assists 1. Observe Notice the bug, gather symptoms "Explain what this error message means" 2. Hypothesize Form theory about cause "What could cause this behavior?" 3. Predict Define what evidence to look for "Generate test cases to isolate this" 4. Test Run debugger, check values "Create a Mermaid diagram of this call flow" 5. Analyze Interpret results "Does this match pattern X?" 6. Fix Implement the solution "Suggest a fix for this root cause"
Notice: YOU lead every step. AI accelerates, but doesn't replace your thinking.
Callback: How Hard Is It to Evaluate?
From L13 : AI can generate for any task, but evaluation difficulty varies:
Easy to Evaluate Hard to Evaluate Does the test pass now? ✓ Did we fix the root cause or just the symptom? Does the error message disappear? ✓ Will this fix cause bugs elsewhere? Does output match expected? ✓ Is this the right fix or a workaround?
AI might "fix" your bug in a way that passes the test but breaks something else.
Your job: Understand the fix , not just accept it.
From L13 - evaluation difficulty:
AI can generate fixes for ANY bug
But some evaluations are trivial, others are hard
"Test passes" ≠ "Bug is correctly fixed"
Why this matters for debugging:
AI fix might introduce NEW bugs
AI fix might address symptom, not cause
AI fix might work for THIS test but fail edge cases
Only YOU can evaluate root cause
The trap:
Test was failing → AI suggested change → test passes → SHIP IT!
But did you understand WHY? Can you verify it's correct?
"It works" is easy to check; "It's the right fix" is hard
Key insight:
Use AI to generate hypotheses and explanations
But YOUR understanding determines if the fix is correct
Don't outsource the EVALUATION step
→ Transition: And just like L13 warned about "vibe coding", we have "vibe debugging"...
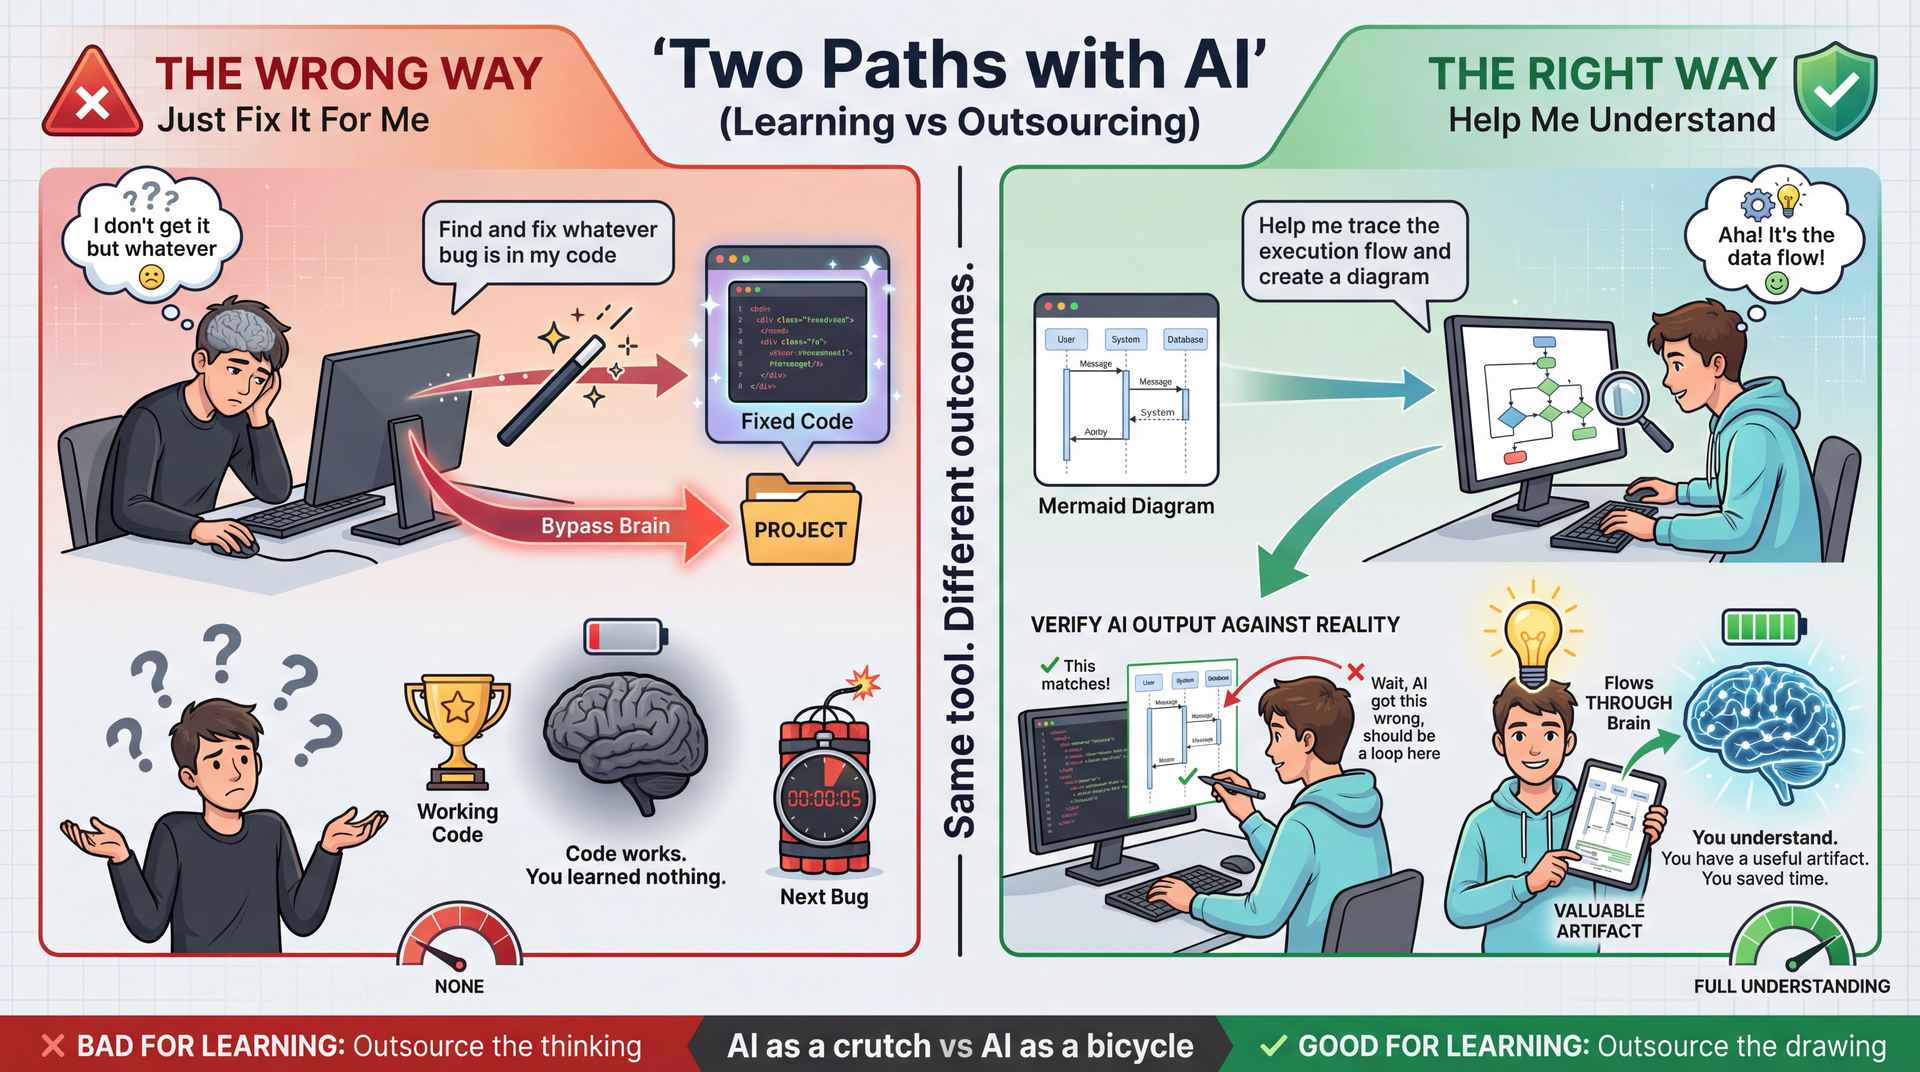
The Right Way to Use AI for Debugging The key distinction:
WRONG: "AI, find and fix my bug" → You learn nothing
RIGHT: "AI, help me understand this code" → You learn AND get useful artifacts
Why diagrams are perfect for AI:
Drawing is tedious, not educational
Understanding is educational, not tedious
Let AI do the tedious part
YOU do the understanding part
The verification step is crucial:
AI might hallucinate incorrect diagrams
Checking the diagram against code = learning
You either confirm understanding or catch AI errors
Either way, you win
The artifact value:
You now have a diagram you can reference
You can share it with teammates
You didn't spend 30 minutes in Mermaid syntax
Time saved on drawing → more time for understanding
→ Transition: Let's put all these tools together...
Summary: Program Understanding & Debugging Debugging is integral to implementation and validation — not a separate phaseControl flow + data flow — trace execution paths AND how values changeDiagrams (call graphs, sequence, class) — visualize what code can't show linearlyScientific method — observe, hypothesize, predict, test, analyze, iterate (same as L13's 6-step workflow!)Debuggers — accelerate hypothesis testing without modifying codeAI assistants — use the same 6-step workflow; YOU must evaluate the fixAvoid "vibe debugging" — if you can't explain the fix, you haven't fixed it
From L13: Task familiarity determines AI appropriateness. If you can't evaluate whether a bug fix is correct, you shouldn't accept AI's suggestion blindly.
From the syllabus: "The hardest parts of building software have never been typing code." Debugging is where understanding proves its value.
Key takeaways:
Debugging is a skill, not a talent
Systematic approach beats random guessing
Tools (debugger, AI) accelerate but don't replace thinking
Readable code pays dividends during debugging
Looking ahead:
Every assignment involves debugging
These skills will serve you throughout your career
Practice the scientific method until it's automatic
→ Transition: Questions?
VS Code Extensions for Mermaid:
Markdown Preview Mermaid Support — Renders Mermaid in previewMermaid Editor — Live editing with preview pane Online Tools:
Debugging Book:
IDE Debugger Guides:
IntelliJ: Help → Find Action → "Debug"
VS Code: Run → Start Debugging (F5)
Next Steps Tomorrow: AI Coding Assistants Lab
Practice the prompting techniques from L13 and today
Thursday: HW3 Due
If you haven't started, start NOW
Recipe collections, JSON serialization, polymorphic types
Use the debugging techniques from today when you get stuck!
Wednesday: Testing
HW3 reminder:
This is the assignment with JsonRecipeCollectionRepository
The diagrams we showed today are directly relevant
If you're stuck on polymorphic serialization, re-watch the sequence diagram walkthrough
Lab tomorrow:
Hands-on practice with AI coding assistants
Try generating diagrams for your own code
Practice the 6-step workflow from L13
→ End of lecture.